
Written by: Chad Jenkins, Ph.D., P.A.S.
KEY TAKEAWAYS IN THIS ISSUE OF TECHNICAL TOPICS:
- More data is being generated now than ever before on dairy farms
- Logging historical performance data provides insights for future decisions
- Record Manager generates reports by interfacing with herd management software and testing services
- Your Standard Dairy Consultant can provide and interpret Record Manager reports for your dairy
Whether we like it or not, we live in a day and age where personal data is being collected and analyzed constantly – sometimes those “targeted ads” I receive on my phone are eerily accurate, as if my device has listened into my private conversations regarding deluxe double Belgian waffle makers. As corporations leverage their data to successfully market products to us, the abundance of data we collect on our dairy cows may be harnessed to help inform decisions and track progress, with the ultimate goal of improving profitability.
This is why Standard Dairy Consultants set out on a project nearly twenty years ago to develop a software platform to amass and summarize data from farm management programs for our customers (and prospective customers), supplying meaningful reports of key performance metrics. Today, Record Manager generates “Standard-ized” reports drawn from leading dairy records platforms including Dairy Comp 305, DHI-Plus, PCDART, BoviSync, and others. These reports help to make clear and concise sense of what can otherwise be an overwhelming deluge of information.
Record Manager utilizes “test day” data to track critical performance, health, and reproductive characteristics of your herd. For herds that don’t use regular testing services, but employ the use of milk meters, “artificial” test days may be generated in order to track monthly progress. One challenge with herd management programs is that sometimes historical, monthly test day data becomes lost in the weeds – Record Manager provides a solution where historical performance is retained and often utilized to be juxtaposed with present-day trends. In addition, to test day information, users may also input averaged monthly herd performance data as reported by the creamery, as well as actual dry matter intake, milk price, and feed cost. With this information, critical financial metrics such as income over feed cost (IOFC) and feed cost per hundredweight may be calculated and tracked from month to month.
Under development in the Record Manager platform, a new tool will allow us to draw from our ever-growing database of herd evaluations. In fact, this database will soon surpass 10,000 test day evaluations, encompassing millions of individual cow records. This new feature will make it possible for summary reports to be generated by filtering for specific date ranges, regions of the U.S., breeds of cows, housing type, and milking frequency. This powerful tool facilitates additional insights for our consultants and clients such as anonymous herd benchmarking or seasonally specific, regional performance comparisons.
Several selections of example Record Manager output figures have been included and discussed below in order to familiarize readers with Record Manager reports as well as to spark potential questions that may be answered with data generated on your dairy.
LACTATION CURVES BY PARITY GROUP
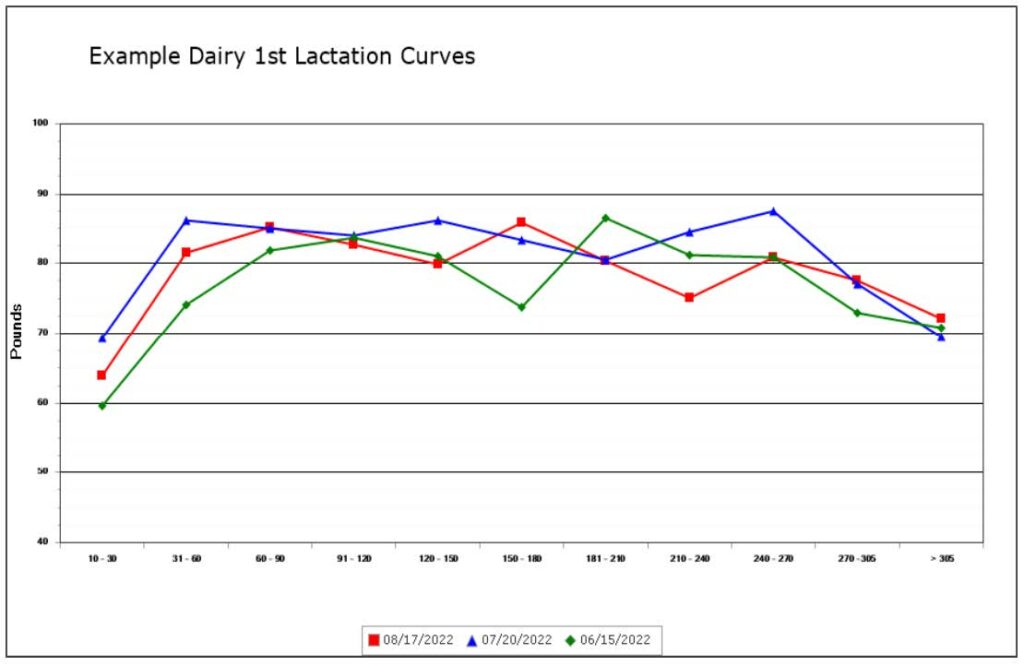
Some of the first figures included with a Record Manger report illustrate lactation curves by parity group, with three different colored lines representing the last three monthly tests (note: these lines can also be configured to represent the corresponding month in the previous year). Lactation curves can provide insight into cow performance across days in milk. For example, in the figure above, 1st lactation animals appeared to be experiencing a decline around 150-180 DIM in the month of June. This observation alone may have warranted investigation by the dairyman and nutritionist such as whether a pen or diet change was occurring for this group of animals and was contributing to a decrease in yield. However, we see that roughly 60 days later on the August test, this same group of animals is contributing to a decline around 210–240 DIM, which highlights the advantages of incorporating historical data.
DIM DISTRIBUTION VERSUS PRODUCTION AVERAGE
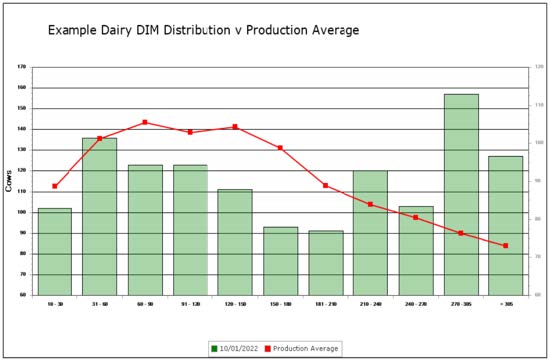
In addition to plotting lactation curves by parity, the above figure is also generated to provide insight into DIM distribution relative to milk yield. Along the x-axis, cows are segmented by DIM and cow numbers are graphed according the left-hand y-axis. The lactation curve for all cows is drawn in red and corresponds to milk yield in lbs on the right-hand y-axis. While plenty of information can be garnered from lactation curves alone, it is important to consider how cows are distributed across the spectrum of DIM. For example, the dairy above seems to be experiencing a steep drop in milk from the 150 – 180 DIM to 181 – 210 DIM cohorts, however, these cohorts also contain the fewest number of cows, where a small number of low producing cows may have a greater impact the average milk yield. Additionally, the largest cohort of cows falls later in lactation and may suggest opportunities for dry-off or culling to back-fill with fresher animals.
PROTEIN/BUTTERFAT INVERSION
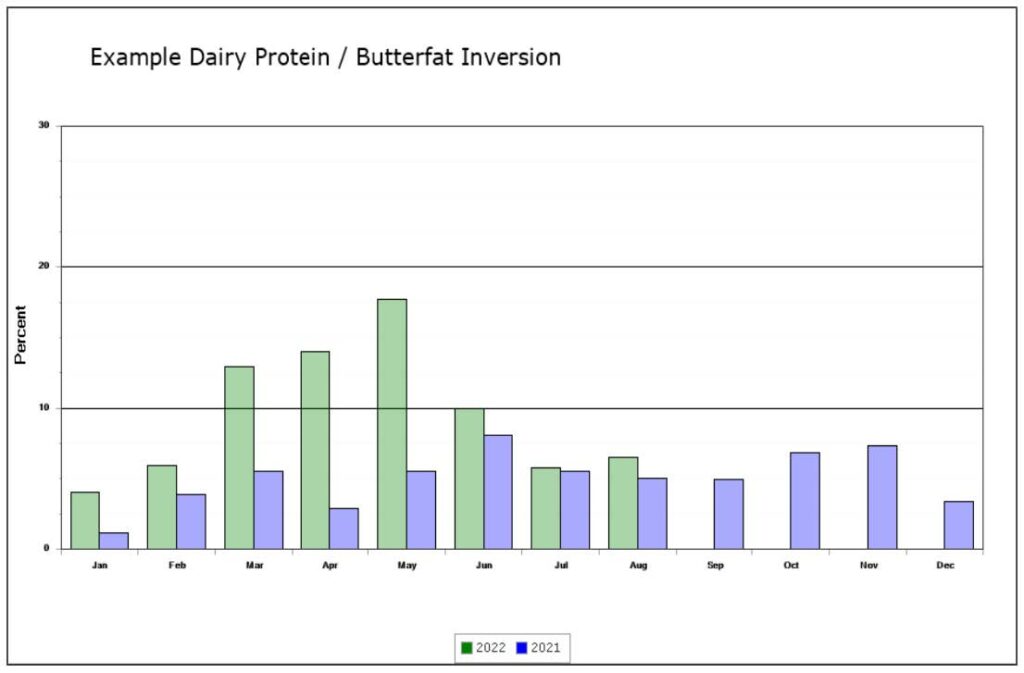
This figure generated by Record Manager illustrates percentage of protein/butterfat inversions in the herd by month compared to the year prior. Protein/butterfat inversions occur when milk protein % is greater than butterfat % and, when in excess in the herd, can be indicative of milk fat depression. In the example above, protein/butterfat inversion remained below 10% for the entire year, though an upward trend can be identified entering the Spring of 2022. The nutritionist likely took corrective action before the June test to identify and correct nutritional risk factors associated with milk fat depression, and inversions returned to levels similar to the previous year.
METABOLIC REPORT
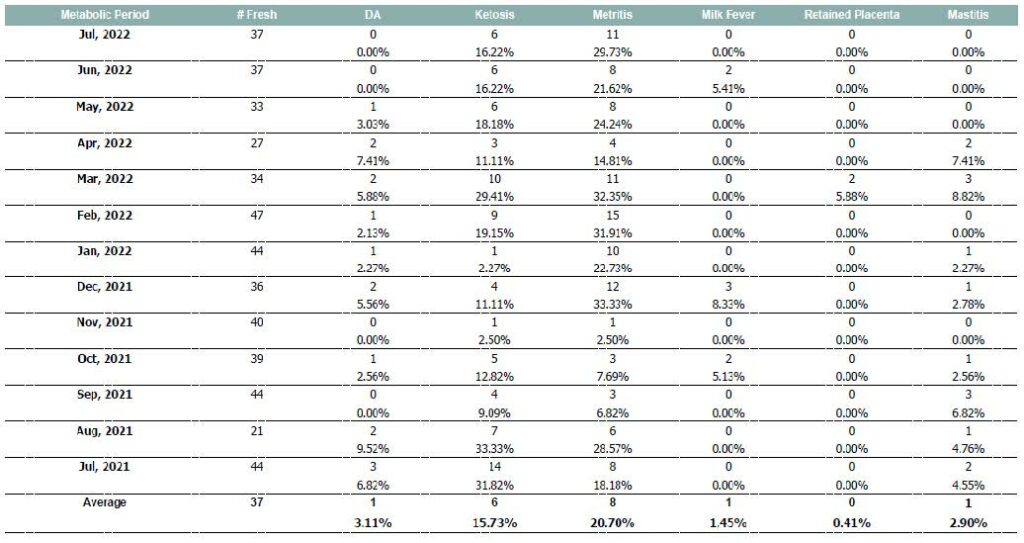
The Metabolic Report is a table created by Record Manager that lists metabolic disease occurrence by month fresh and calculates incidence percentage according to the number of animals freshened. The Metabolic Report provides a straightforward way to keep a tally of metabolic issues associated with transition that we all wish to avoid. The corresponding month of the prior year is listed at the bottom of the table; this particular herd was able to cut ketosis incidence in July in half compared to the year prior.
CONCLUSION
With advancements in dairy technology, tremendous amounts of data are being generated on a daily basis. Data-driven decisions require collection, summarization, and interpretation of this mass of data, which can often be an arduous task. Record Manager was generated to automate portions of this process to empower our consultants and dairies with meaningful, reliable, information in a timely and regular manner. Whether you are a customer of Standard Dairy Consultants or not, your Standard representative would be obliged to assist in collecting test day information and discuss a Record Manager report with you on their next visit.
